Spaces:
Sleeping

Sleeping
File size: 17,204 Bytes
32a1d6d |
1 2 3 4 5 6 7 8 9 10 11 12 13 14 15 16 17 18 19 20 21 22 23 24 25 26 27 28 29 30 31 32 33 34 35 36 37 38 39 40 41 42 43 44 45 46 47 48 49 50 51 52 53 54 55 56 57 58 59 60 61 62 63 64 65 66 67 68 69 70 71 72 73 74 75 76 77 78 79 80 81 82 83 84 85 86 87 88 89 90 91 92 93 94 95 96 97 98 99 100 101 102 103 104 105 106 107 108 109 110 111 112 113 114 115 116 117 118 119 120 121 122 123 124 125 126 127 128 129 130 131 132 133 134 135 136 137 138 139 140 141 142 143 144 145 146 147 148 149 150 151 152 153 154 155 156 157 158 159 160 161 162 163 164 165 166 167 168 169 170 171 172 173 174 175 176 177 178 179 180 181 182 183 184 185 186 187 188 189 190 191 192 193 194 195 196 197 198 199 200 201 202 203 204 205 206 207 208 209 210 211 212 213 214 215 216 217 218 219 220 221 222 223 224 225 226 227 228 229 230 231 232 233 234 235 236 237 238 239 240 241 242 243 244 245 246 247 248 249 250 251 252 253 254 255 256 257 258 259 260 261 262 263 264 265 266 267 268 269 270 271 272 273 274 275 276 277 278 279 280 281 282 283 284 285 286 287 288 289 290 291 292 293 294 295 296 297 298 299 300 301 302 303 304 305 306 307 308 309 310 311 312 313 314 315 316 317 318 319 320 321 322 323 324 325 326 327 328 329 330 331 332 333 334 335 336 337 338 339 340 341 342 343 344 345 346 347 348 349 350 351 352 353 354 355 356 357 358 359 360 361 362 363 364 365 366 367 368 369 370 371 372 373 374 375 376 377 378 379 380 381 382 383 384 385 386 387 388 389 390 391 392 393 394 395 396 397 398 399 400 401 402 403 404 405 406 407 408 409 410 411 412 413 414 415 416 417 418 419 420 421 422 423 424 425 426 427 428 429 430 431 432 433 434 435 436 437 438 439 440 441 442 443 444 445 446 447 448 449 450 451 452 453 454 455 456 457 458 459 460 461 462 463 464 465 466 467 468 469 470 471 472 473 474 475 476 477 |
import time
from functools import lru_cache
import pandas as pd
import streamlit as st
import streamlit_ace as stace
import duckdb
import numpy as np # for user session
import scipy # for user session
import plotly_express
import plotly.express as px # for user session
import plotly.figure_factory as ff # for user session
import matplotlib.pyplot as plt # for user session
import sklearn
from ydata_profiling import ProfileReport
from streamlit_pandas_profiling import st_profile_report
st.set_page_config(page_title="PySQLify", page_icon="🔎", layout="wide")
st.title("PySQLify")
st.write("_Data Analysis_ Tool")
p = st.write
print = st.write
display = st.write
@st.cache_data
def _read_csv(f, **kwargs):
df = pd.read_csv(f, on_bad_lines="skip", **kwargs)
# clean
df.columns = [c.strip() for c in df.columns]
return df
def timer(func):
def wrapper_function(*args, **kwargs):
start_time = time.time()
func(*args, **kwargs)
st.write(f"`{(time.time() - start_time):.2f}s.`")
return wrapper_function
SAMPLE_DATA = {
"Churn dataset": "https://raw.githubusercontent.com/AtashfarazNavid/MachineLearing-ChurnModeling/main/Streamlit-WebApp-1/Churn.csv",
"Periodic Table": "https://gist.githubusercontent.com/GoodmanSciences/c2dd862cd38f21b0ad36b8f96b4bf1ee/raw/1d92663004489a5b6926e944c1b3d9ec5c40900e/Periodic%2520Table%2520of%2520Elements.csv",
"Movies": "https://raw.githubusercontent.com/reisanar/datasets/master/HollywoodMovies.csv",
"Iris Flower": "https://gist.githubusercontent.com/netj/8836201/raw/6f9306ad21398ea43cba4f7d537619d0e07d5ae3/iris.csv",
"World Population": "https://gist.githubusercontent.com/curran/13d30e855d48cdd6f22acdf0afe27286/raw/0635f14817ec634833bb904a47594cc2f5f9dbf8/worldcities_clean.csv",
"Country Table": "https://raw.githubusercontent.com/datasciencedojo/datasets/master/WorldDBTables/CountryTable.csv",
"World Cities": "https://raw.githubusercontent.com/dr5hn/countries-states-cities-database/master/csv/cities.csv",
"World States": "https://raw.githubusercontent.com/dr5hn/countries-states-cities-database/master/csv/states.csv",
"World Countries": "https://raw.githubusercontent.com/dr5hn/countries-states-cities-database/master/csv/countries.csv"
}
def read_data():
txt = "Upload a data file (supported files: .csv)"
placeholder = st.empty()
with placeholder:
col1, col2, col3 = st.columns([3, 2, 1])
with col1:
file_ = st.file_uploader(txt, help="TODO: .tsv, .xls, .xlsx")
with col2:
url = st.text_input(
"Read from a URL",
placeholder="Enter URL (supported types: .csv and .tsv)",
)
if url:
file_ = url
with col3:
selected = st.selectbox("Select a sample dataset", options=[""] + list(SAMPLE_DATA))
if selected:
file_ = SAMPLE_DATA[selected]
if not file_:
st.stop()
placeholder.empty()
# kwargs = {"skiprows": st.number_input("skip header", value=0, max_value=10)}
kwargs = {"skiprows": 0}
try:
return _read_csv(file_, **kwargs)
except Exception as e:
st.warning("Unsupported file type!")
st.stop()
def display(df):
view_info = st.sidebar.checkbox("view data types")
st.dataframe(df, use_container_width=True)
# info
st.markdown(f"> <sup>shape `{df.shape}`</sup>", unsafe_allow_html=True)
if view_info:
types_ = df.dtypes.to_dict()
types_ = [{"Column": c, "Type": t} for c, t in types_.items()]
df_ = pd.DataFrame(types_)
st.sidebar.subheader("TABLE DETAILS")
st.sidebar.write(df_)
def code_editor(language, hint, show_panel, key=None, content=None):
# Spawn a new Ace editor
placeholder = st.empty()
default_theme = "solarized_dark" if language == "sql" else "chrome"
with placeholder.expander("CELL CONFIG"):
# configs
_THEMES = stace.THEMES
_KEYBINDINGS = stace.KEYBINDINGS
col21, col22 = st.columns(2)
with col21:
theme = st.selectbox("Theme", options=[default_theme] + _THEMES, key=f"{language}1{key}")
tab_size = st.slider("Tab size", min_value=1, max_value=8, value=4, key=f"{language}2{key}")
with col22:
keybinding = st.selectbox("Keybinding", options=[_KEYBINDINGS[-2]] + _KEYBINDINGS, key=f"{language}3{key}")
font_size = st.slider("Font size", min_value=5, max_value=24, value=14, key=f"{language}4{key}")
height = st.slider("Editor height", value=130, max_value=777,key=f"{language}5{key}")
# kwargs = {theme: theme, keybinding: keybinding} # TODO: DRY
if not show_panel:
placeholder.empty()
content = stace.st_ace(
value=content if content else "",
language=language,
height=height,
show_gutter=False,
# annotations="",
placeholder=hint,
keybinding=keybinding,
theme=theme,
font_size=font_size,
tab_size=tab_size,
key=key
)
# Display editor's content as you type
# content
return content
@st.cache_data
def query_data(sql, df):
try:
return duckdb.query(sql).df()
except Exception as e:
st.warning("Invalid Query!")
# st.stop()
def download(df, key, save_as="results.csv"):
# -- to download
# @st.cache_data
def convert_df(_df):
return _df.to_csv().encode("utf-8")
csv = convert_df(df)
st.download_button(
"Download",
csv,
save_as,
"text/csv",
key=key
)
def display_results(query: str, result: pd.DataFrame, key: str):
st.dataframe(result, use_container_width=True)
st.markdown(f"> `{result.shape}`")
download(result, key=key)
@timer
def run_python_script(user_script, key):
if user_script.startswith("st.") or ";" in user_script:
py = user_script
elif user_script.endswith("?"): # -- same as ? in Jupyter Notebook
in_ = user_script.replace("?", "")
py = f"st.help({in_})"
else:
py = f"st.write({user_script})"
try:
cmds = py.split(";")
for cmd in cmds:
exec(cmd)
except Exception as e:
c1, c2 = st.columns(2)
c1.warning("Wrong Python command.")
if c2.button("Show error", key=key):
st.exception(e)
@st.cache_resource
def data_profiler(df):
return ProfileReport(df, title="Profiling Report")
def docs():
content = """
# What
Upload a dataset to process (manipulate/analyze) it using SQL and Python, similar to running Jupyter Notebooks.
To get started, drag and drop the dataset file, read from a URL, or select a sample dataset. To load a new dataset, refresh the webpage.
> <sub>[_src code_ here](https://github.com/iamaziz/sqlify)</sub>
More public datasets available [here](https://github.com/fivethirtyeight/data).
# Usage
Example usage
> After loading the sample Iris dataset from sklearn (or select it from the dropdown list), the lines below can be executed inside a Python cell:
```python
from sklearn.datasets import load_iris;
from sklearn import tree;
iris = load_iris();
X, y = iris.data, iris.target;
clf = tree.DecisionTreeClassifier(max_depth=4);
clf = clf.fit(X, y);
plt.figure(figsize=(7,3));
fig, ax = plt.subplots()
tree.plot_tree(clf, filled=True, fontsize=4);
st.pyplot(fig)
```
Which outputs the tree below:
> <img width="1000" alt="image" src="https://user-images.githubusercontent.com/3298308/222992623-1dba9bad-4858-43b6-84bf-9d7cf78d61f7.png">
# SCREENSHOTS
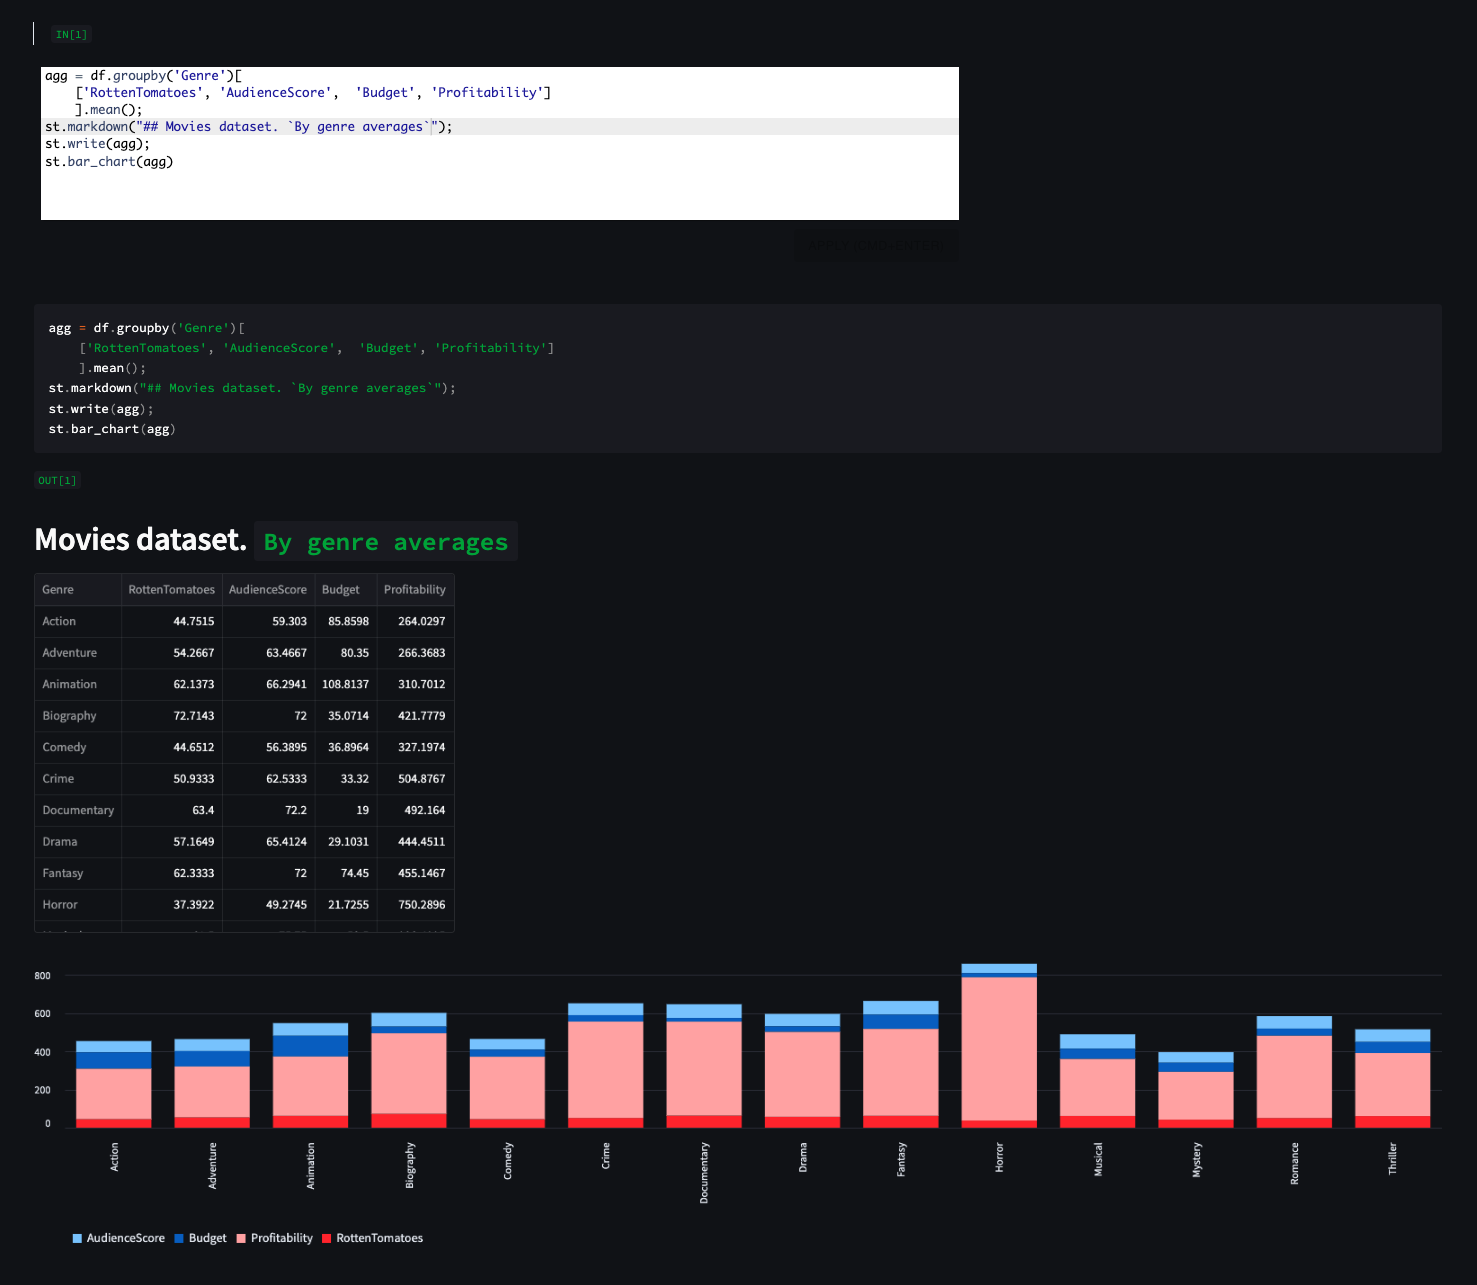
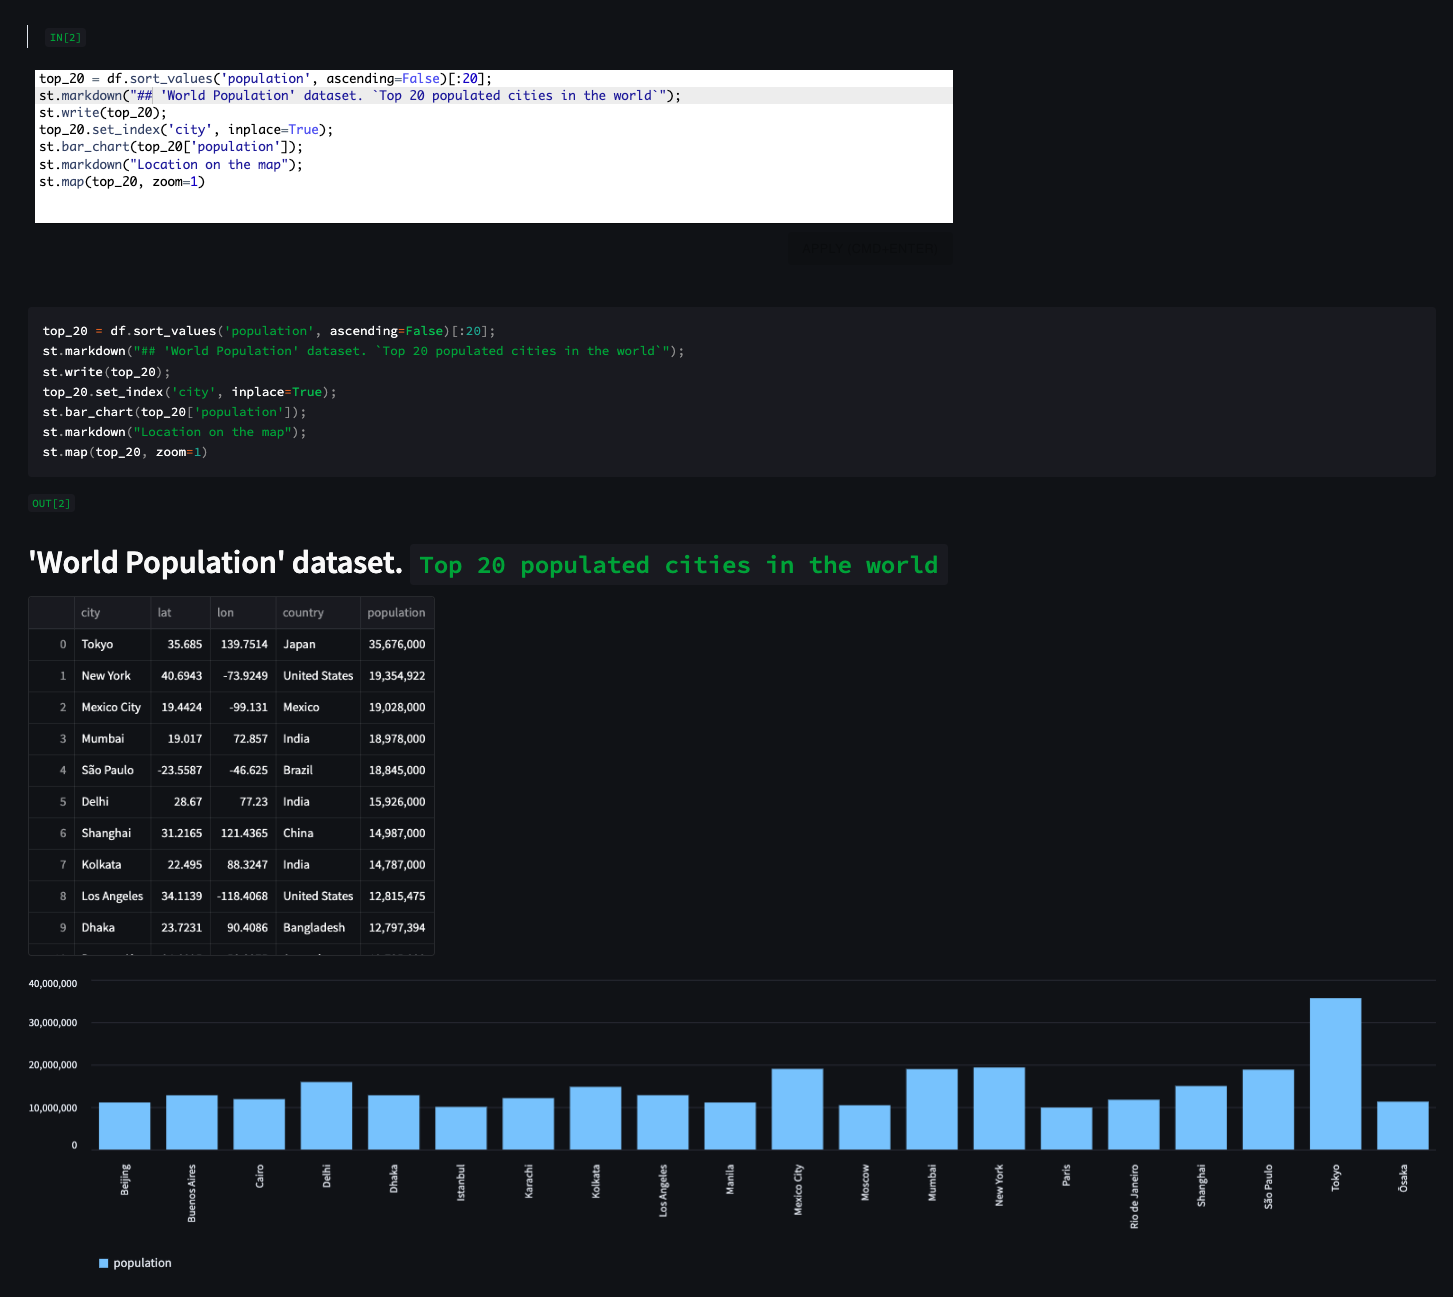
## _EXAMPLE 1_
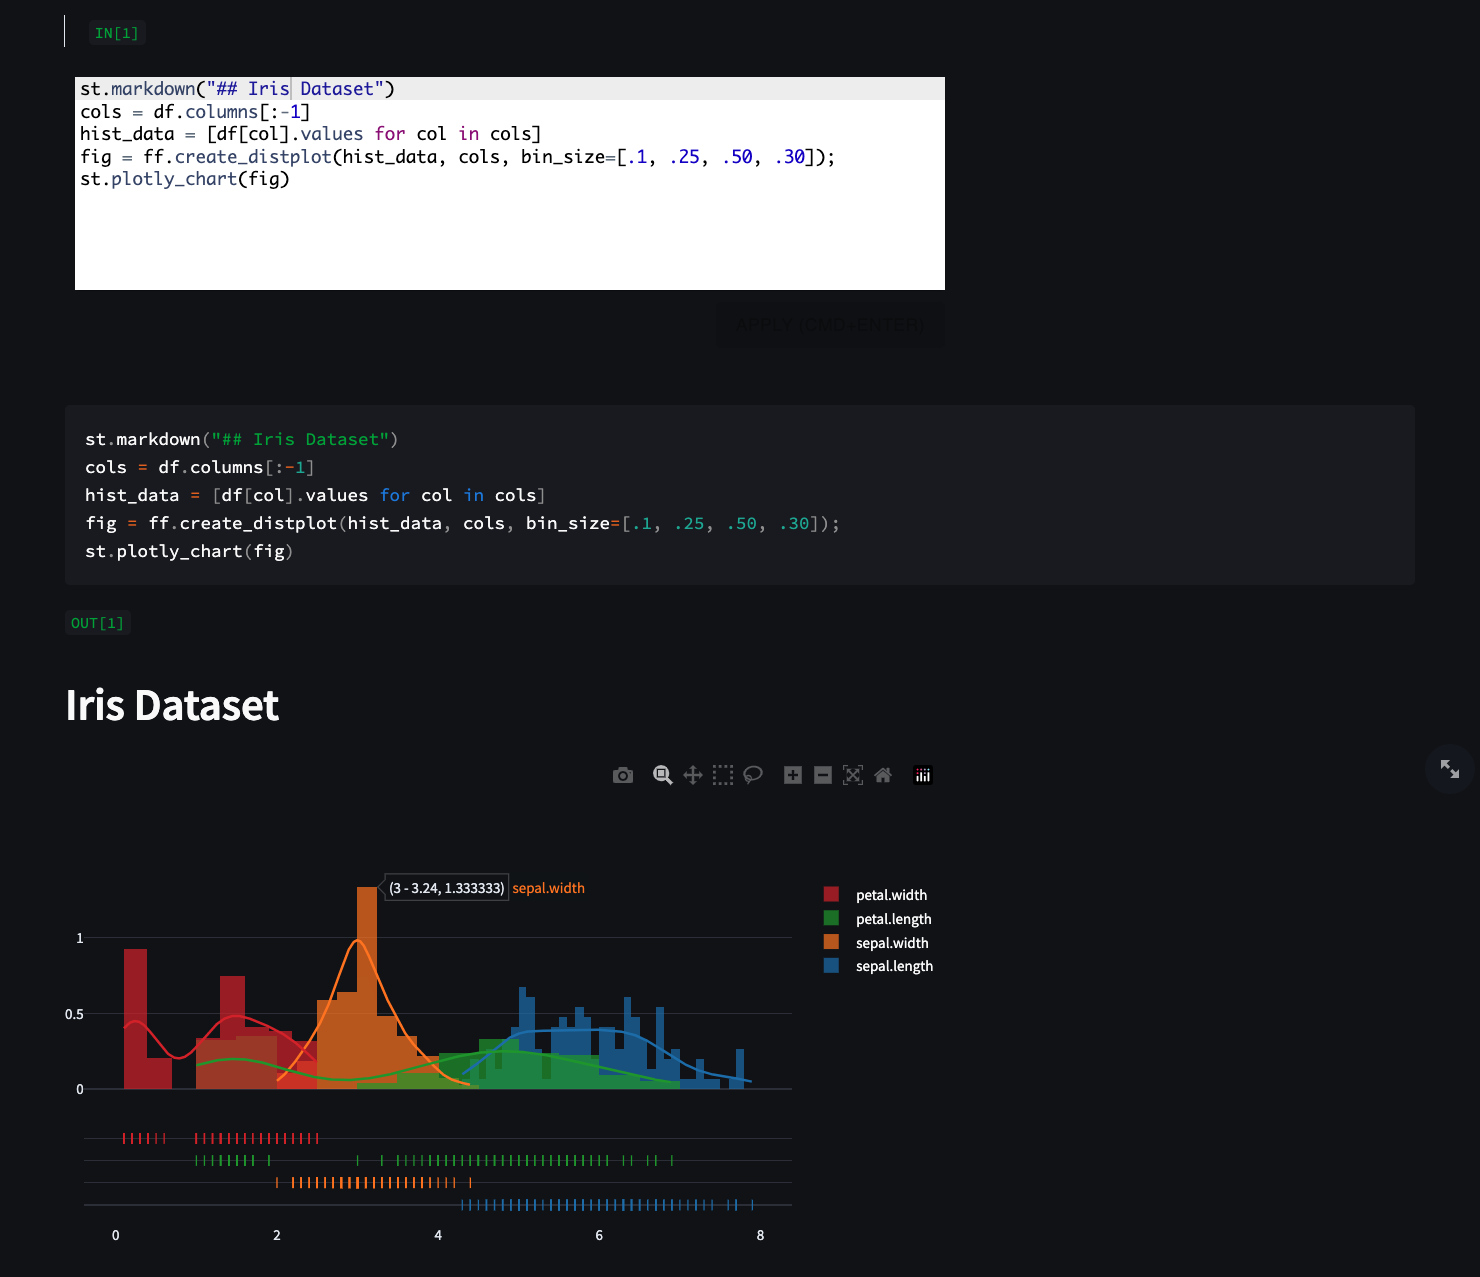
## _EXAMPLE 2_

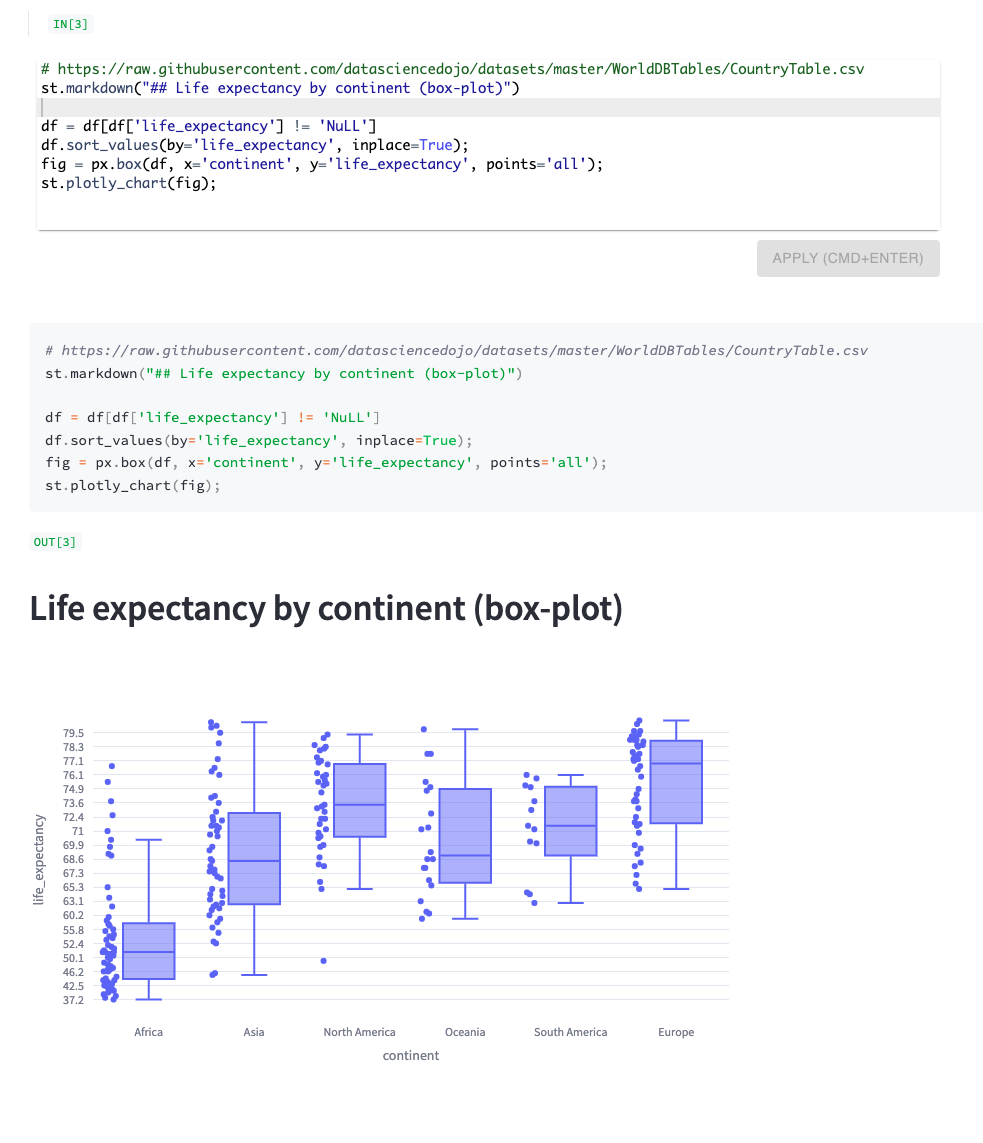
## _EXAMPLE 3_
## _EXAMPLE 4_
"""
with st.expander("READE"):
st.markdown(content, unsafe_allow_html=True)
return st.checkbox("Show more code examples")
def display_example_snippets():
from glob import glob
examples = glob("./examples/*")
with st.expander("EXAMPLES"):
example = st.selectbox("", options=[""] + examples)
if example:
with open(example, "r") as f:
content = f.read()
st.code(content)
class GPTWrapper:
def __init__(self):#, df_info):
from gpt import AnthropicSerivce, OpenAIService
self.anthropic_model = AnthropicSerivce()
self.df_info = df_info
@staticmethod
@st.cache_data
def ask_sql(df_info, question):
from gpt import OpenAIService
openai_model = OpenAIService()
prompt = GPTWrapper().build_sql_prompt(df_info, question)
res = openai_model.prompt(prompt)
return res, prompt
@staticmethod
@st.cache_data
def ask_python(df_info, question):
from gpt import OpenAIService
openai_model = OpenAIService()
prompt = GPTWrapper().build_python_prompt(df_info, question)
res = openai_model.prompt(prompt)
return res, prompt
@staticmethod
@st.cache_data
def build_sql_prompt(df_info, question):
prompt = f"""I have data in a pandas dataframe, here is the data schema: {df_info}
Next, I will ask you a question. Assume the table name is `df`.
And you will answer in writing a SQL query only. {question}
"""
return prompt
@staticmethod
@st.cache_data
def build_python_prompt(df_info, question):
prompt = f"""I have data in a pandas dataframe, here is the dataframe schema: {df_info}
Next, I will ask you a question. And you will answer in writing a Python code only.
Assume the data is stored in a variable named `df`.
Here are some instructions for the generated Python code:
- You should always use the variable `df` to refer to the dataframe.
- You should not include any markdown syntax or any other syntax that is not Python in the answer.
- Import any required libraries in the first line of the generated code.
- Just show the Python code only, don't include any Python comments or English explanation in the answer text.
- If the generarted code has multiple Python lines, every Python line must end with a semicolon (;).
- If the answer is not a plot or a figure, always use print to print the answer using print().
- If the answer requires plotting, generate a plot using plotly_express and show it using st.plotly_chart(fig).
Here is the question: {question}
"""
return prompt
def ask_gpt_sql(df_info, key):
# -- GPT AI
# agi = GPTWrapper(df_info=df_info)
question = st.text_input("Ask a question about the dataset to get a SQL query that answers the question",
placeholder="How many rows are there in the dataset?",
key=key
)
if question:
# res, prompt = agi.ask_sql(df_info, question)
res, prompt = GPTWrapper().ask_sql(df_info, question)
# st.markdown(f"```{prompt}```")
sql_query = res.choices[0].message.content
st.code(sql_query, language="sql")
return sql_query
def ask_gpt_python(df_info, key):
# -- GPT AI
# agi = GPTWrapper(df_info=df_info)
question = st.text_input("Ask a question about the dataset to get a Python code that answers the question",
placeholder="How many rows and columns are there in the dataset?",
key=key
)
if question:
# res, prompt = agi.ask_python(df_info, question)
res, prompt = GPTWrapper().ask_python(df_info, question)
# st.markdown(f"```{prompt}```")
python_code = res.choices[0].message.content
st.code(python_code, language="python")
# st.markdown(f"```{python_code}```", unsafe_allow_html=True)
return python_code
if __name__ == "__main__":
show_examples = docs()
if show_examples:
display_example_snippets()
df = read_data()
display(df)
# -- data schema
import io
sio = io.StringIO()
df.info(buf=sio)
df_info = sio.getvalue()
# st.markdown(f"```{df_info}```", unsafe_allow_html=True)
# run and execute SQL script
def sql_cells(df):
st.write("---")
st.header("SQL")
hint = """Type SQL to query the loaded dataset, data is stored in a table named 'df'.
For example, to select 10 rows:
SELECT * FROM df LIMIT 10
Describe the table:
DESCRIBE TABLE df
"""
number_cells = st.sidebar.number_input("Number of SQL cells to use", value=1, max_value=40)
for i in range(number_cells):
key = f"sql{i}"
col1, col2 = st.columns([2, 1])
st.markdown("<br>", unsafe_allow_html=True)
show_panel = False #col2.checkbox("Show cell config panel", key=f"{i}-sql")
col1.write(f"> `IN[{i+1}]`")
# with col2:
# -- GPT AI
query = ask_gpt_sql(df_info, key=f"{key}-gpt")
content = None
if query and st.button("Use SQL", key=f"{key}-use-sql"):
content = query
# with col1:
sql = code_editor("sql", hint, show_panel=show_panel, key=key, content=content if content else None)
if sql:
st.code(sql, language="sql")
st.write(f"`OUT[{i+1}]`")
res = query_data(sql, df)
display_results(sql, res, f"{key}{sql}")
# run and dexectue python script
def python_cells():
st.write("---")
st.markdown("### Python")
hint = """Type Python command (one-liner) to execute or manipulate the dataframe e.g. `df.sample(7)`. By default, results are rendered using `st.write()`.
📊 Visulaization example: from "movies" dataset, plot average rating by genre:
st.line_chart(df.groupby("Genre")[["RottenTomatoes", "AudienceScore"]].mean())
🗺 Maps example: show the top 10 populated cities in the world on map (from "Cities Population" dataset)
st.map(df.sort_values(by='population', ascending=False)[:10])
NOTE: for multi-lines, a semi-colon can be used to end each line e.g.
print("first line");
print("second line);
"""
hint = """Type Python code here (use semicolons to end each line)"""
help = """
For multiple lines, use semicolons e.g.
```python
fig, ax = plt.subplots();
ax.hist(df[[col1, col2]]);
st.pyplot(fig);
```
or
```python
groups = [group for _, group in df.groupby('class')];
for i in range(3):
st.write(groups[i]['name'].iloc[0])
st.bar_chart(groups[i].mean())
```
"""
number_cells = st.sidebar.number_input("Number of Python cells to use", value=1, max_value=40, min_value=1, help=help)
for i in range(number_cells):
# st.markdown("<br><br><br>", unsafe_allow_html=True)
col1, col2 = st.columns([2, 1])
# col1.write(f"> `IN[{i+1}]`")
show_panel = False # col2.checkbox("Show cell config panel", key=f"panel{i}")
# -- GPT AI
query = ask_gpt_python(df_info, key=f"{i}-gpt")
content = None
if query and st.checkbox("Use generated code", key=f"{i}-use-python"):
content = query
user_script = code_editor("python", hint, show_panel=show_panel, key=i, content=content if content else None)
if user_script:
df.rename(columns={"lng": "lon"}, inplace=True) # hot-fix for "World Population" dataset
st.write(f"> `IN[{i+1}]`")
st.code(user_script, language="python")
st.write(f"> `OUT[{i+1}]`")
run_python_script(user_script, key=f"{user_script}{i}")
if st.sidebar.checkbox("Show SQL cells", value=True):
sql_cells(df)
if st.sidebar.checkbox("Show Python cells", value=True):
python_cells()
st.sidebar.write("---")
if st.sidebar.checkbox("Generate Data Profile Report", help="pandas profiling, generated by [ydata-profiling](https://github.com/ydataai/ydata-profiling)"):
st.write("---")
st.header("Data Profiling")
profile = data_profiler(df)
st_profile_report(profile)
st.write("---") |